SonarQube: Install Open Source Code Analysis Tool on Kubernetes
By 8grams Tech
SonarQube is an open-source platform developed by SonarSource for continuous inspection of code quality to perform automatic reviews with static analysis of code to detect bugs, code smells, and security vulnerabilities on 20+ programming languages.
Introduction
SonarQube is an open-source platform developed by SonarSource for continuous inspection of code quality to perform automatic reviews with static analysis of code to detect bugs, code smells, and security vulnerabilities on 20+ programming languages. It integrates with your existing workflow to enable continuous code inspection across your project branches and pull requests. SonarQube provides a detailed report of the health of an application and highlights issues newly introduced. With its various plugins, it integrates with most continuous integration and delivery systems, making it a staple in the toolchain for many developers and software engineers who prioritize quality in their codebase.
Benefit of using SonarQube
The motivation behind the creation of SonarQube stems from the need for maintaining code quality, which is crucial for developing reliable, maintainable, and secure software. Prior to tools like SonarQube, reviewing code for potential bugs, vulnerabilities, and maintaining coding standards was often a manual process, prone to human error and highly time-consuming.
As software projects grow in size and complexity, it becomes increasingly difficult to track and manage code quality. The creators of SonarQube recognized the need for an automated system that could consistently monitor code for technical debt and issues that affect code maintainability, performance, and security.
By automating the code review process, SonarQube helps developers to:
- Detect and fix issues early: Catching bugs and vulnerabilities early in the development cycle saves time and resources and prevents issues from reaching production.
- Enforce coding standards: It ensures that the team adheres to a set of coding standards and practices, leading to more readable and maintainable code.
- Track technical debt: It provides insights into technical debt and helps teams to prioritize the refactoring efforts.
- Improve code security: It helps in identifying security hotspots and vulnerabilities, thus reducing the chances of security breaches.
- Educate developers: It also serves as an educational tool for developers by providing feedback on best practices and guiding them on how to write better and cleaner code.
Thus, the creation of SonarQube was driven by the goal of enhancing code quality and efficiency in software development processes through automation and continuous inspection.
How SonarQube Works
SonarQube functions by scrutinizing source code in a detailed and systematic manner. It is integrated within the software development workflow, typically activating during the continuous integration process when new code is committed to the version control system.
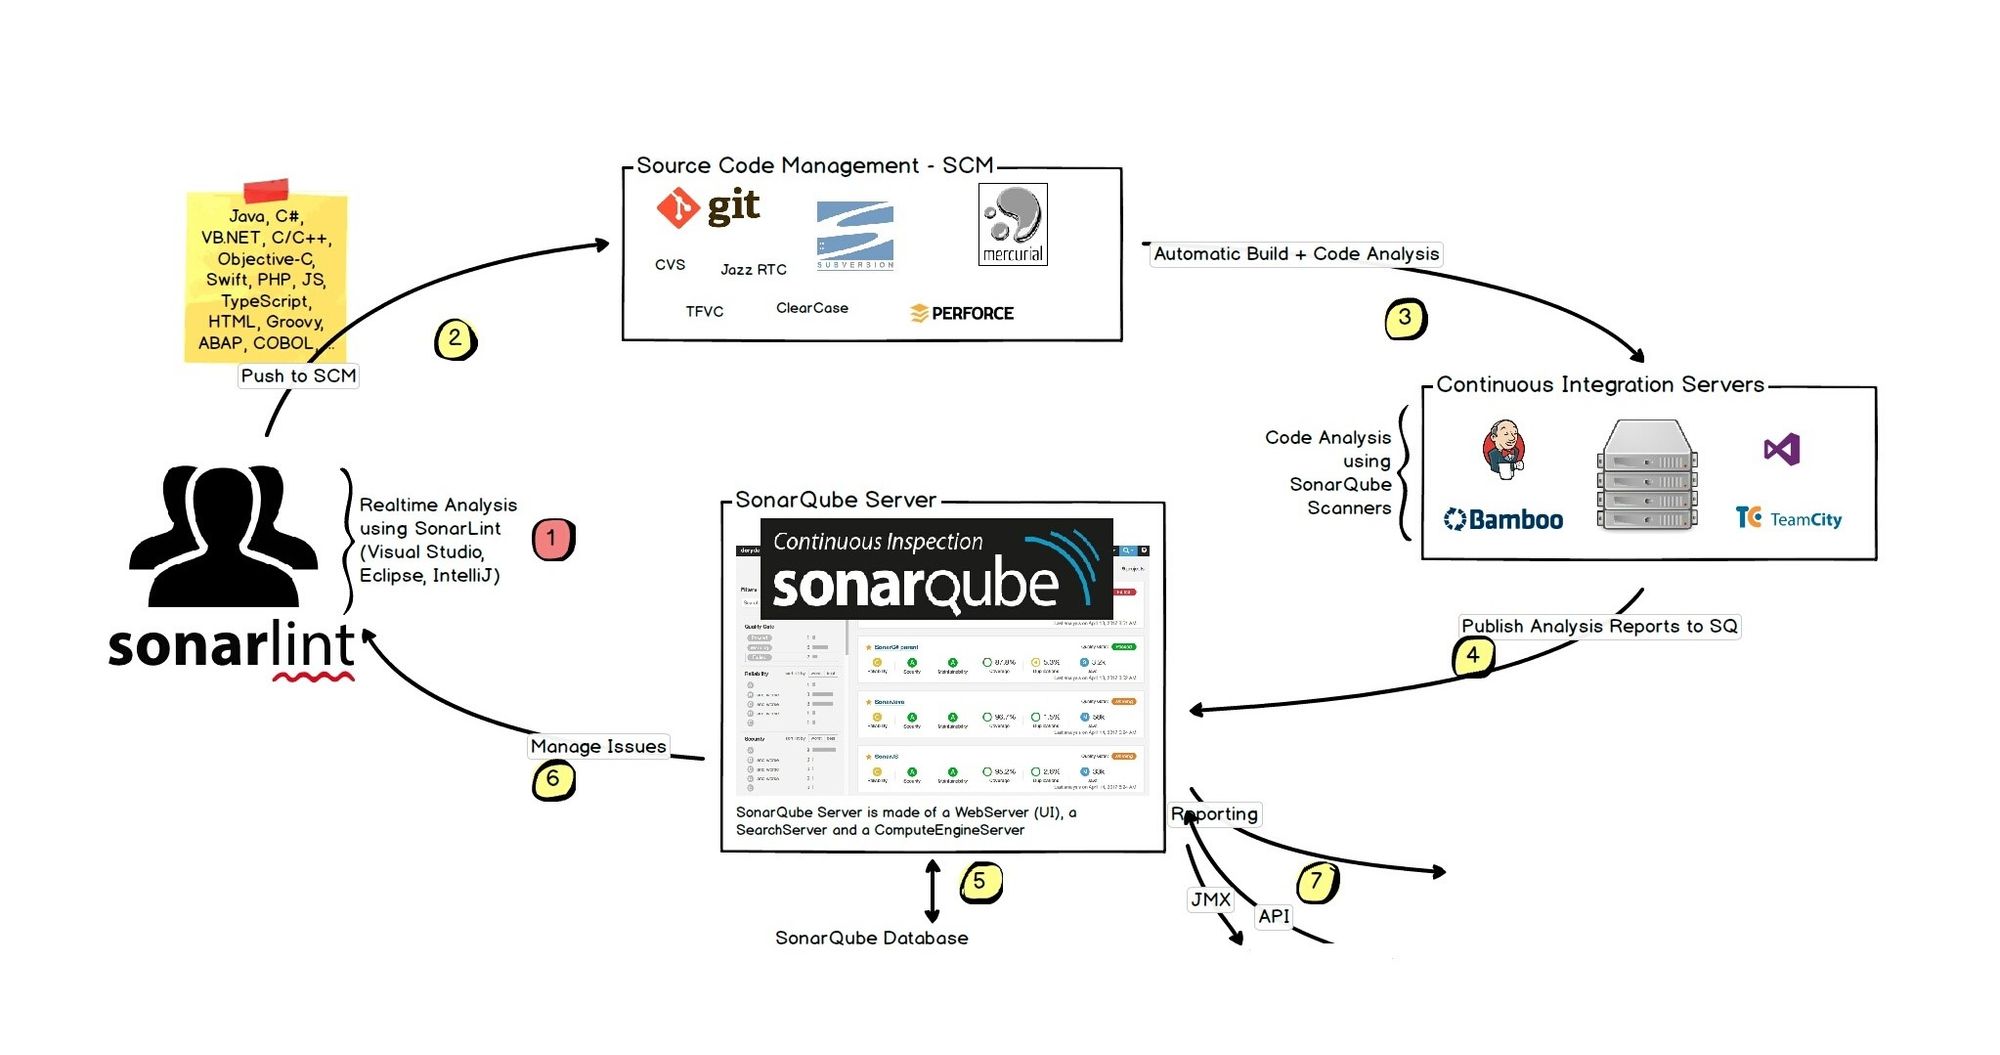
The core operation begins with the SonarQube scanner, which reads the code without executing it — this is known as static analysis. It reviews the code against predefined rules and patterns to identify issues. These rules can range from potential bugs and security vulnerabilities to code smells, which are patterns in the code that may not be bugs but could potentially cause issues in the future.
Once the scan is complete, SonarQube compiles the findings into a comprehensive report. This report offers a dashboard that developers can use to get a clear view of the code quality, highlighting problems like duplicated code, coding standards violations, and complex code structures that could be simplified.
The platform also offers a historical view of the code quality, allowing developers to track their progress in improving the code over time. This historical perspective is not just about finding what’s wrong, but also about verifying the effectiveness of ongoing efforts to maintain or enhance code quality.
Furthermore, SonarQube can be configured to fail a build if certain criteria are not met, ensuring that new code meets the project's quality standards before it is merged and deployed. This creates a sort of "quality gate" that new changes must pass, thus integrating code quality checks directly into the software development process.
Architecture of SonarQube
The architecture of SonarQube is designed to be robust and scalable, supporting everything from small projects to large enterprise systems. It consists of several components that work together to ensure seamless code quality analysis and management:
Server
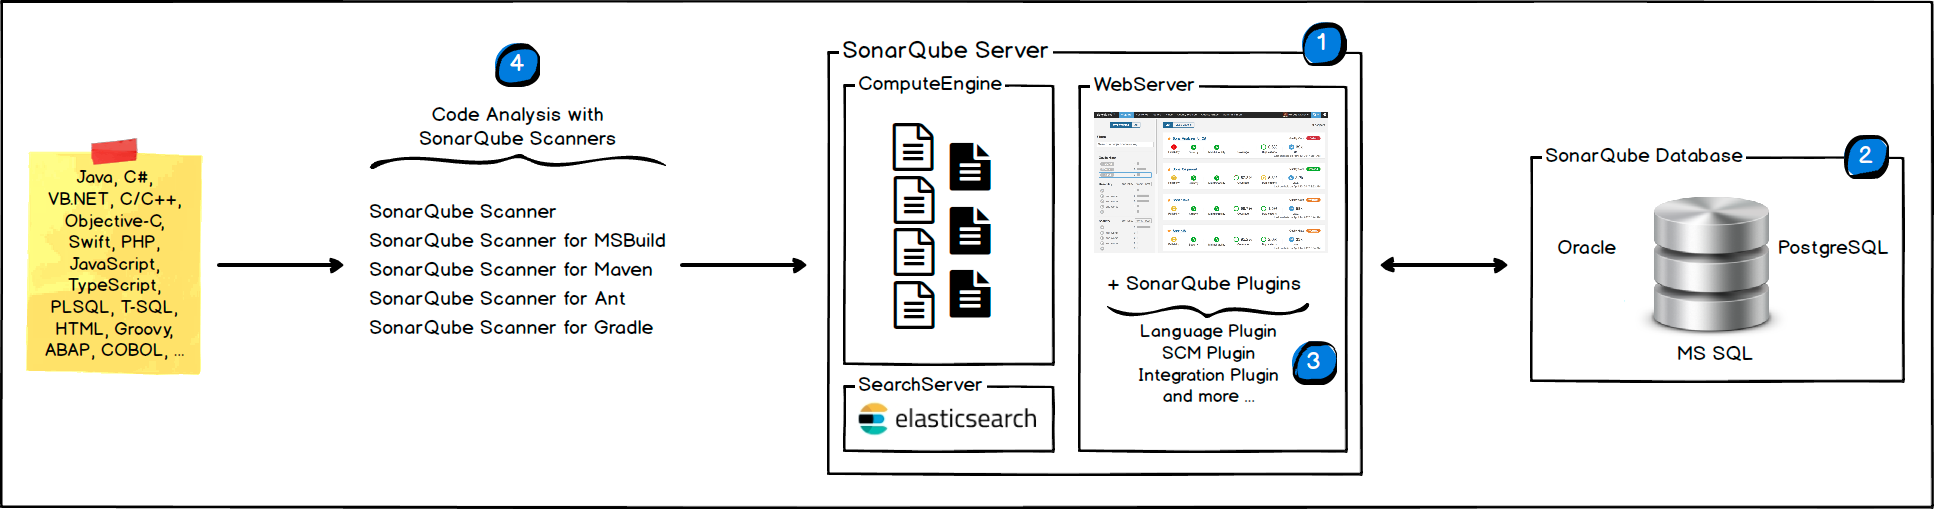
The SonarQube server is the central component that includes the web user interface and database. It processes the code analysis results, stores them, and displays them in a detailed dashboard. It's typically composed of three main parts:
- Web Server: It serves the SonarQube user interface and exposes the web-based API.
- Search Server: Usually powered by Elasticsearch, it indexes the analysis results to allow for fast searching and quick retrieval within the UI.
- Compute Engine: This processes code analysis reports and saves the results in the SonarQube database.
Database
SonarQube uses a database to store the current configuration, the quality snapshots of each project analysis, and the user information. This database can be an instance of a variety of database management systems like PostgreSQL, Microsoft SQL Server, or Oracle.
Scanner
The scanner is a client-side command-line tool that you run on your build server or your local machine to analyze your project's source code. There are different scanners for different build systems and environments. Once the code is scanned, the scanner sends the report to the SonarQube server for processing.
Plugins
SonarQube supports plugins that extend its functionality, such as language analyzers, integration plugins for continuous integration servers, and source control systems. These plugins can be installed on the server to enhance the server's capabilities.
Quality Profiles and Quality Gates
Quality Profiles are essentially a set of rules that projects should be checked against during analysis, and Quality Gates are the conditions or thresholds that determine the quality of a project.
Continuous Integration (CI) Servers
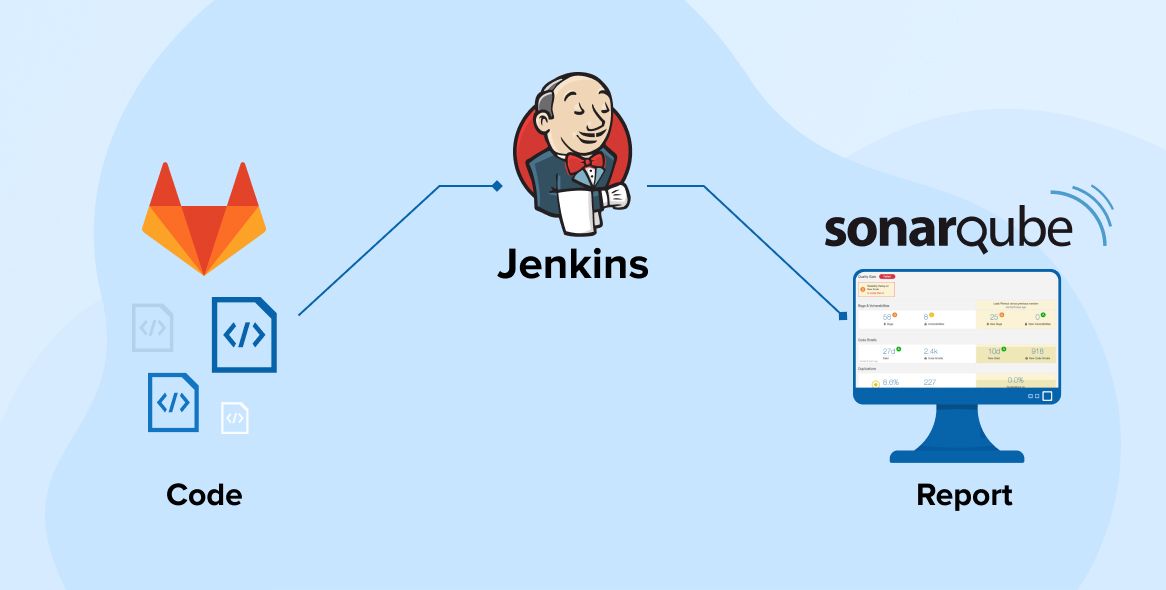
Though not a part of SonarQube itself, it often integrates with CI servers like Jenkins, TeamCity, or Azure DevOps. These systems can trigger SonarQube scans as part of the CI pipeline.
This architecture enables SonarQube to fit into a variety of development environments while providing a consistent and centralized way to manage code quality. It's flexible enough to be used by developers on their local machines as well as to be fully integrated into large-scale CI/CD pipelines for continuous analysis and feedback.
SonarQube on DevOps Cycle
In the DevOps cycle, which emphasizes the unification of development (Dev) and operations (Ops) to improve agility and reduce the time from development to deployment, SonarQube plays a critical role in the 'Dev' aspect, particularly in the Continuous Integration (CI) and Continuous Delivery (CD) practices.
Here's how SonarQube fits within the DevOps circle:
Continuous Integration (CI)
When developers commit code to the version control repository, the CI server automatically runs a series of steps to build and test the code. SonarQube is integrated into these steps to perform static code analysis. It ensures that new code conforms to quality standards before it's merged into the main branch.
Continuous Delivery (CD)
After CI, SonarQube's role continues by enforcing Quality Gates. If the code passes these gates, it's deemed ready for deployment to production. SonarQube ensures that code quality is assessed before deployment, making it less likely that defects or issues are pushed to production.
Feedback and Monitoring
In DevOps, feedback is critical. SonarQube provides detailed feedback on code quality directly to developers. This feedback loop allows for quick remediation, which is key to maintaining high velocity in a DevOps environment.
Collaboration and Communication
DevOps emphasizes the need for better communication and collaboration between developers, QA, and operations. SonarQube acts as a common platform where all stakeholders can view code quality metrics and understand the health of the software, fostering a culture of transparency and shared responsibility for quality.
Continuous Improvement
The metrics and historical trends provided by SonarQube enable teams to measure their progress in improving code quality over time, aligning with the DevOps principle of continuous improvement.
By integrating SonarQube into the DevOps cycle, organizations ensure that code quality is a shared responsibility and that it is continuously monitored and improved, which is at the heart of the DevOps philosophy. This integration is vital for reducing lead time, increasing deployment frequency, and ensuring reliable releases in the DevOps cycle.
Install SonarQube on Kubernetes
SonarQube can be straightforwardly installed on Kubernetes using the Helm chart template provided by 8grams, available at: https://github.com/8grams/microk8s-helm-chart. So make sure you already have Helm installed on your machine.
And also, SonarQube requires PostgreSQL. You can install PostgreSQL on Kubernetes as well on your Kubernetes Cluster. Check this article on How to install PostgreSQL on Kubernetes Cluster.
First, we need to download Helm Chart Template
~$ git clone [email protected]:8grams/microk8s-helm-chart.git chartsThen, create a file values.yaml to override default Helm Values
Install it
~$ helm install sonarqube ./charts/general -n sonarqube -f values.yaml --create-namespaceCheck Installation
~$ kubectl -n sonarqube get deployment
NAME                     READY   UP-TO-DATE   AVAILABLE   AGE
sonarqube-general        1/1     1            1           54m
And also, check Ingress
~$ ~$ kubectl -n sonarqube get ingress
NAME                    HOSTS
sonarqube-general       sonarqube.example.com
Looks good! Now you have a powerful Open Source Code Analysis tool installed on your own Kubernetes Cluster. You can access SonarQube Web Admin on https://sonarqube.example.com .
Frequently Asked Questions
What is SonarQube?
SonarQube is an open-source platform from SonarSource for continuous inspection of code quality. It performs automatic static analysis to detect bugs, code smells, and security vulnerabilities across more than 20 programming languages. SonarQube integrates with your existing workflow to inspect code on project branches and pull requests and reports on the overall health of an application.
How does SonarQube work?
SonarQube works by running a scanner that reads source code without executing it, a process called static analysis. The scanner checks the code against predefined rules to find bugs, vulnerabilities, and code smells, then sends the results to the SonarQube server. The server compiles them into a dashboard and can fail a build that misses quality thresholds.
What is a quality gate in SonarQube?
A quality gate is a set of conditions or thresholds that code must meet before it is considered ready to merge or deploy. SonarQube evaluates new code against these criteria, and if the code fails the gate the build can be stopped. Quality gates embed code quality checks directly into the CI/CD pipeline.
How do you install SonarQube on Kubernetes?
You can install SonarQube on Kubernetes using a Helm chart such as the 8grams microk8s-helm-chart template, and it requires a PostgreSQL database. Clone the chart, create a values.yaml to override defaults, then run helm install sonarqube with the general chart and your namespace. Verify the deployment and ingress with kubectl and open the web admin.
What is SonarQube used for?
SonarQube is used to automate code review and enforce code quality throughout the development lifecycle. Teams use it to catch bugs and vulnerabilities early, enforce coding standards, track technical debt, and improve security. In a DevOps cycle it runs during continuous integration and enforces quality gates before code is delivered to production.
Home, away, and third kits each tell a different part of a club story because matchday clothing can express loyalty without needing many words. Shirts associated with the Bundesliga often become memorable because the competition gives them a clear place in football history. When supporters think about matchday clothing, Rangers football shirts remains one way to link football history with the practical choice of a shirt. When fabric details are part of the choice, the collection angle remains tied to football memories.