Introducing Cockpit, a Project Dashboard from 8grams
By 8grams Tech
During our software development business, there has always been one thing that has consistently posed a challenge for us, which is how to monitor the progress of multiple projects simultaneously
Background
During our software development business, there has always been one thing that has consistently posed a challenge for us, which is how to monitor the progress of multiple projects simultaneously. This is not an issue when only one or two projects are running concurrently. However, the situation changes when we have, let's say, 5-10 projects running simultaneously. Project managers and relevant stakeholders require a way to view the status of all these projects at a bird's eye view.
We have tried various methods to solve this problem. Initially, we used Excel or spreadsheets to track project status. However, these tools did not provide a comprehensive and objective overview. We also struggled to interpret the data because it was displayed as rows of cells in a spreadsheet.
We also once created a dashboard summarizing task completions from all projects. However, this approach failed to provide insights into the actual status of a project. The summary of tasks did not reflect the real project conditions. For instance, suppose all tasks have been completed, but there are internal or project owner blockers preventing us from progressing with development, and thus, no new tasks can be created. In this scenario, the task summary would indicate that all tasks have been completed, but in reality, the project is still hindered in its progress.
Introducing Cockpit
After exploring many ideas and tools, we decided to try creating our own project monitoring tool that suits our needs. We were inspired by a Jira Extension called Hill Chart. Later, we also have to give credit to Basecamp because we found out that this Jira extension was directly inspired by the Hill Chart in Basecamp.
We created a simple tool that we named Cockpit, meaning the control center in an aircraft. With Cockpit, we can easily monitor the status of all ongoing projects. You can try it for free at https://cockpit.8grams.tech. This tool is free, with no usage limitations. We do not collect your data or track your activities while using this application.
The application is easy to use. You only need a Gmail account to register or log in to the application.
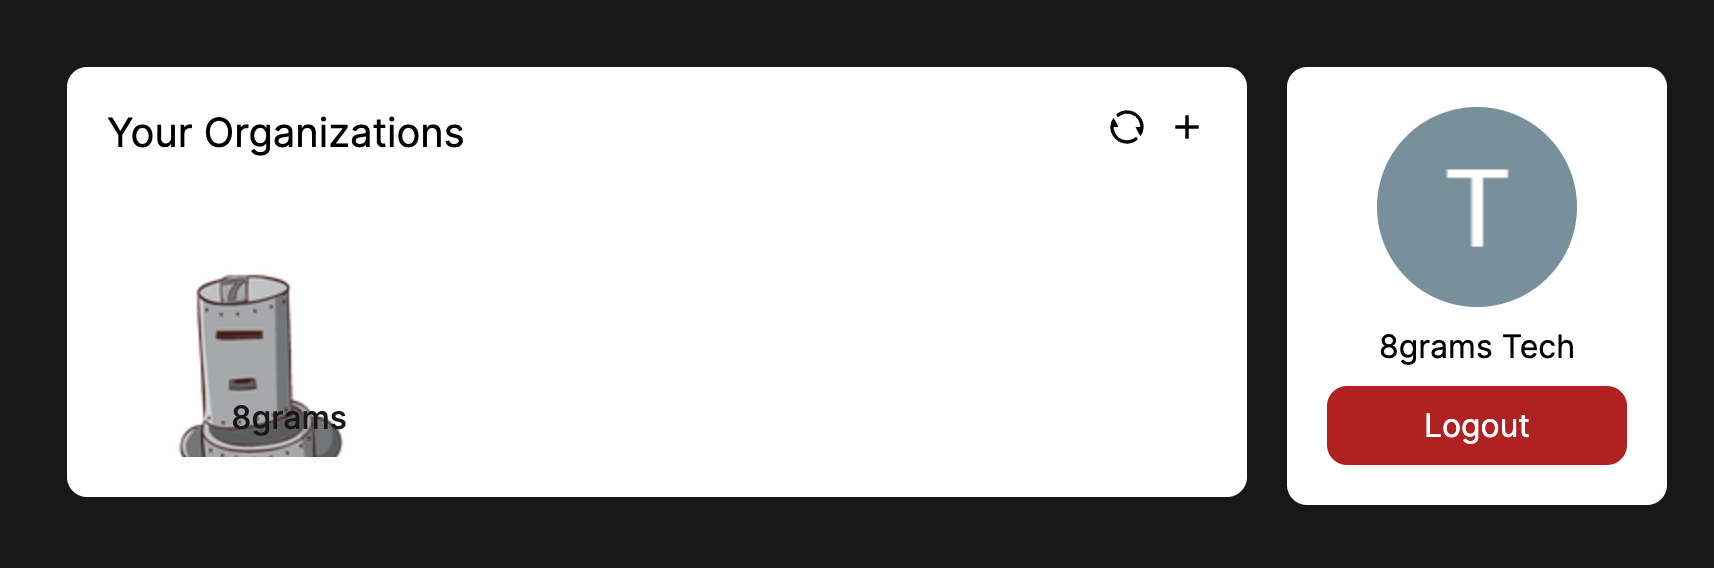
After successfully entering the application, you need to create an organization if you don't already have one. An organization is a container for projects, and an organization can have many projects within it. Each user can have multiple organizations.
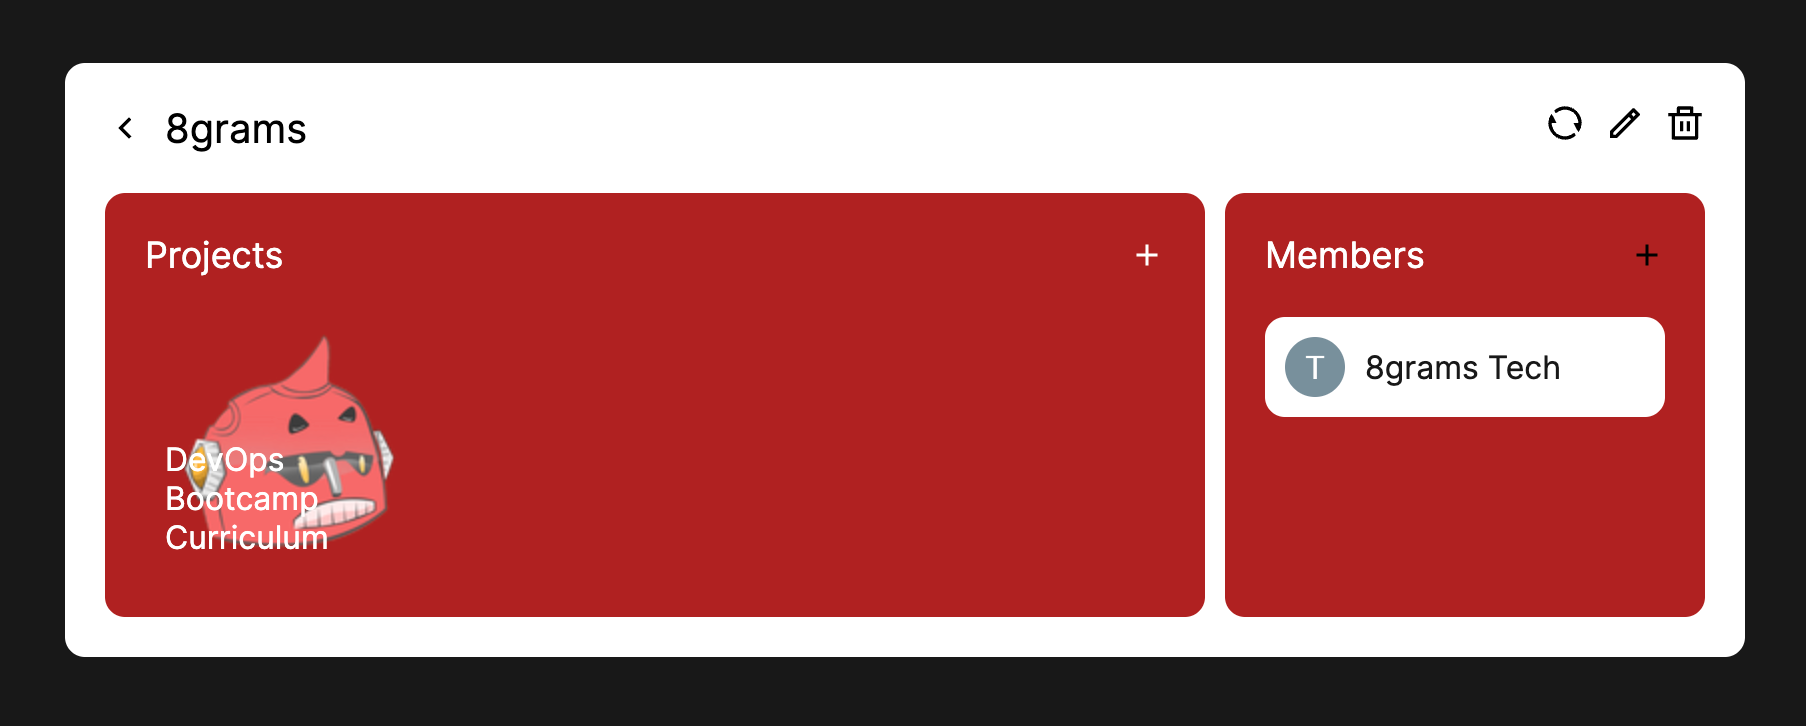
After creating an organization, you can start monitoring projects, starting by creating a project. After creating a project, you can see the main functions of Cockpit.
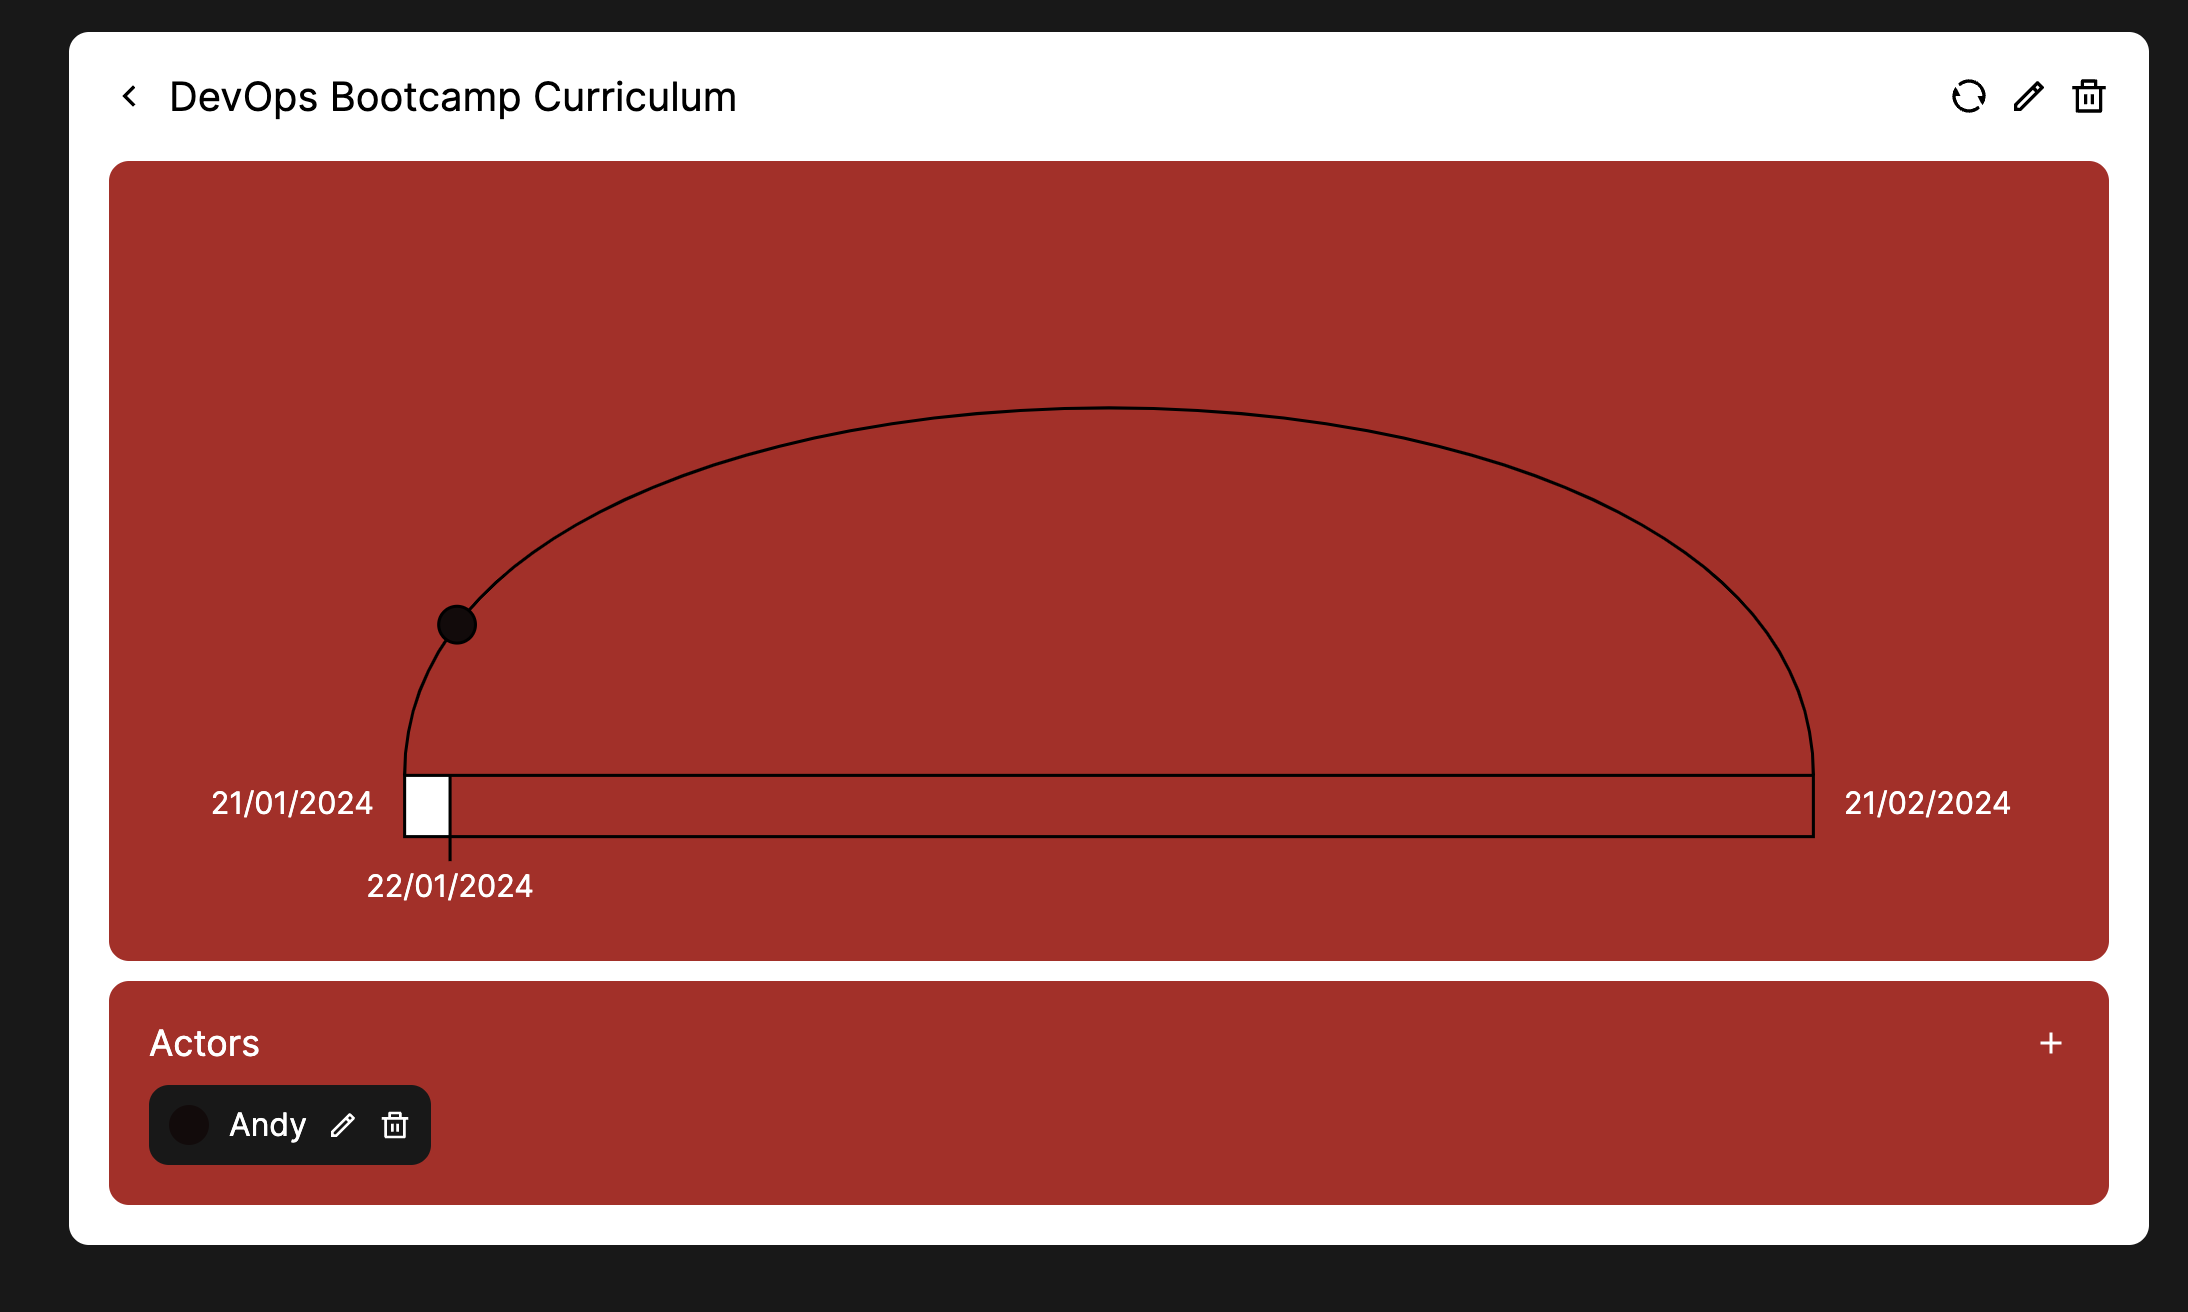
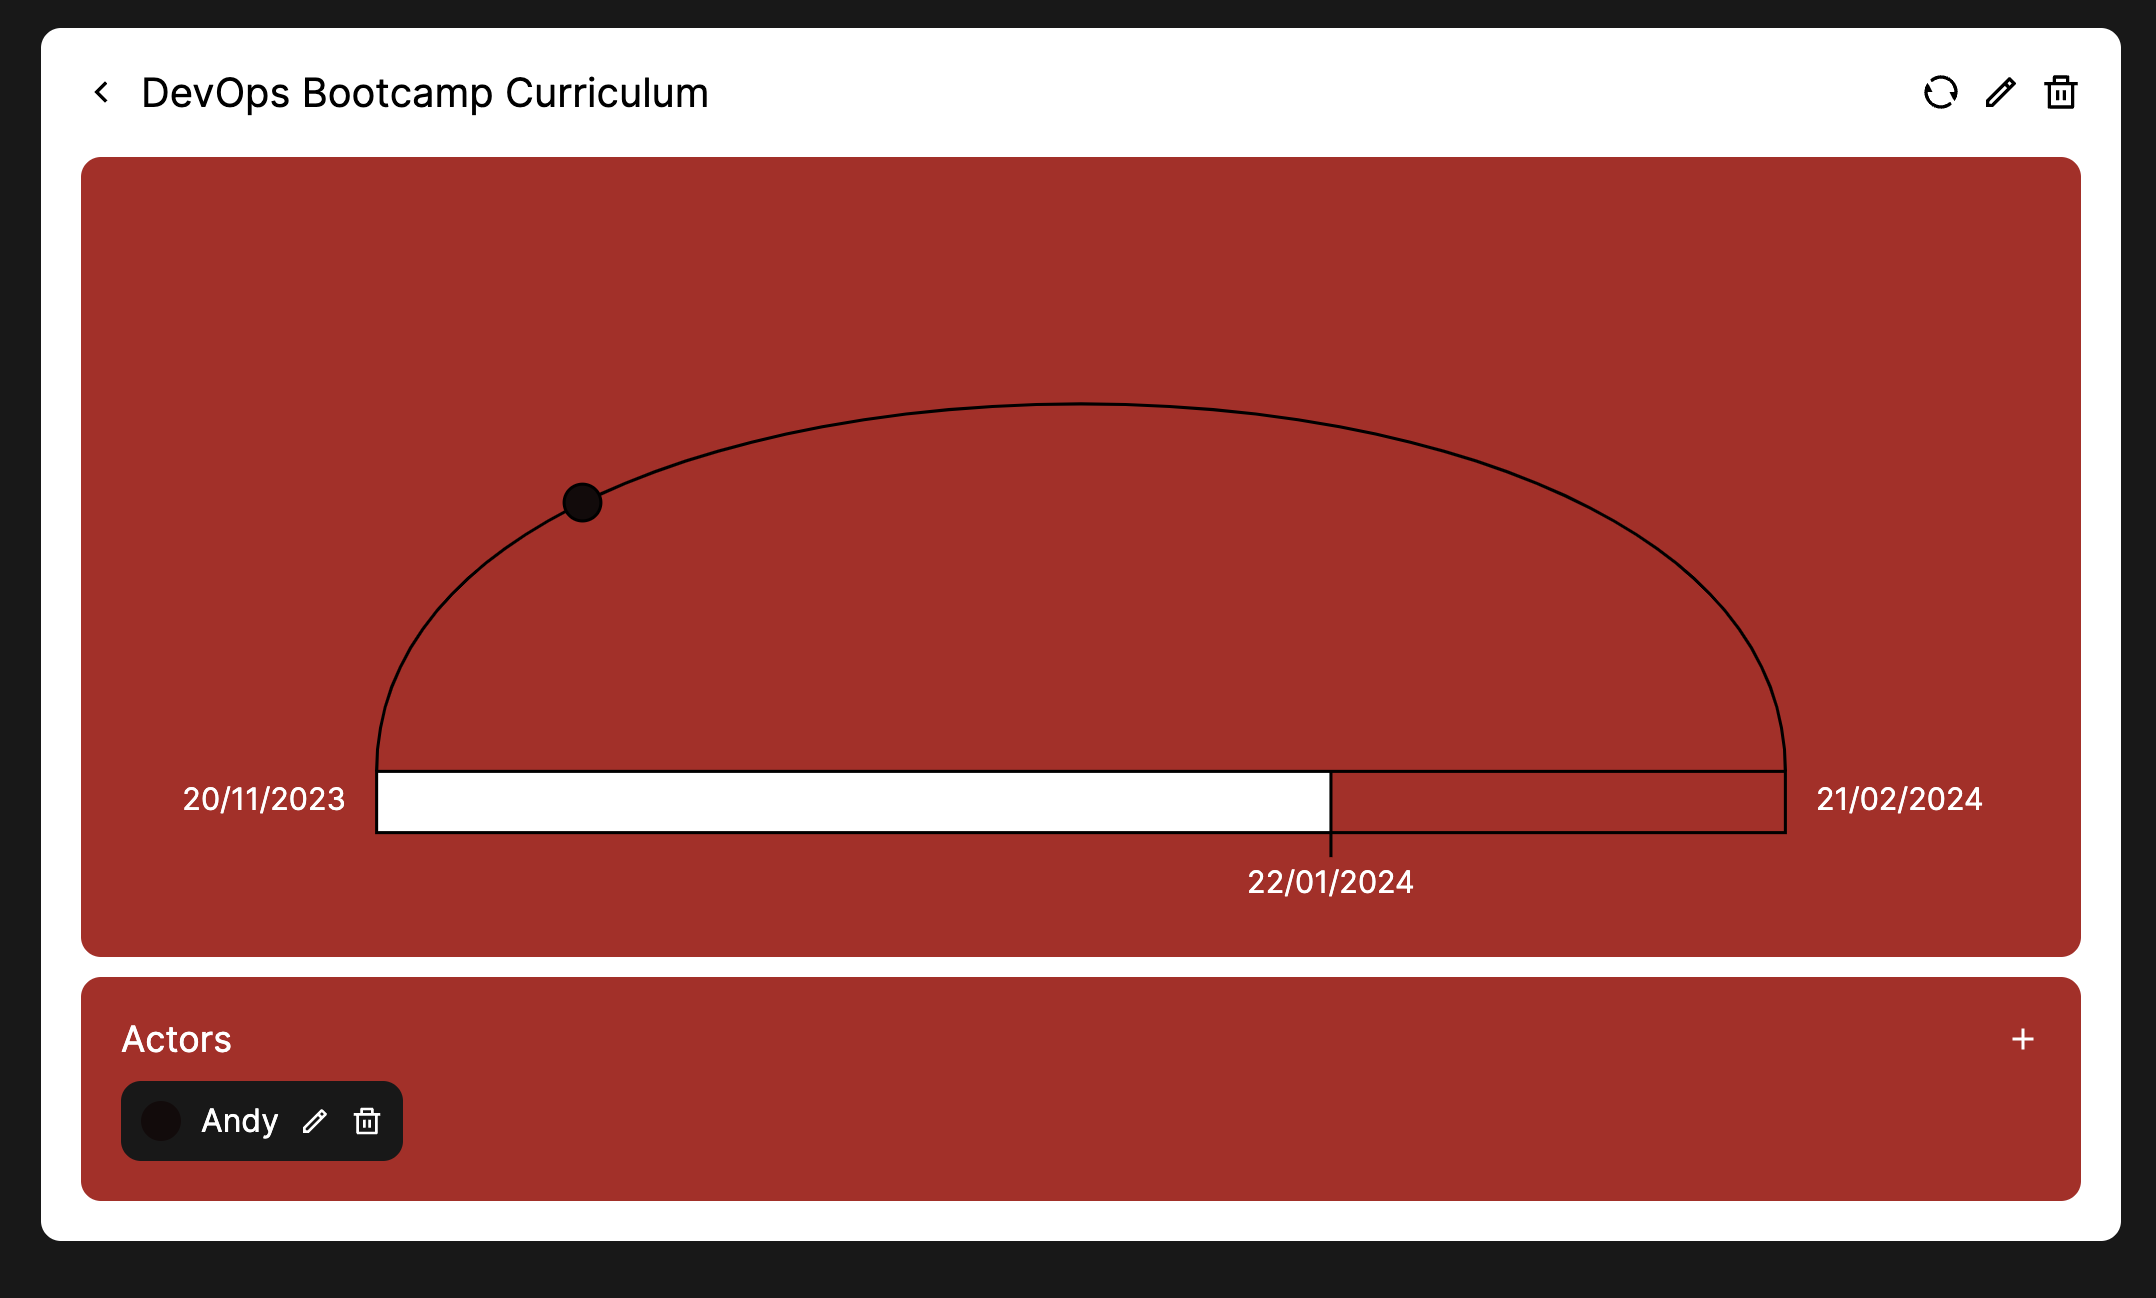
You will be presented with a simple diagram consisting of three components: Timeline, Progress Line, and Actors. For Actors, you need to create at least one actor to work with this diagram.
Timeline
The Timeline depicts the project's timeline. The start date of the project is in the bottom left corner, and the end date is in the bottom right corner. The Timeline is like a loading bar where each day continuously shifts to the right towards the project's end date.
Actors
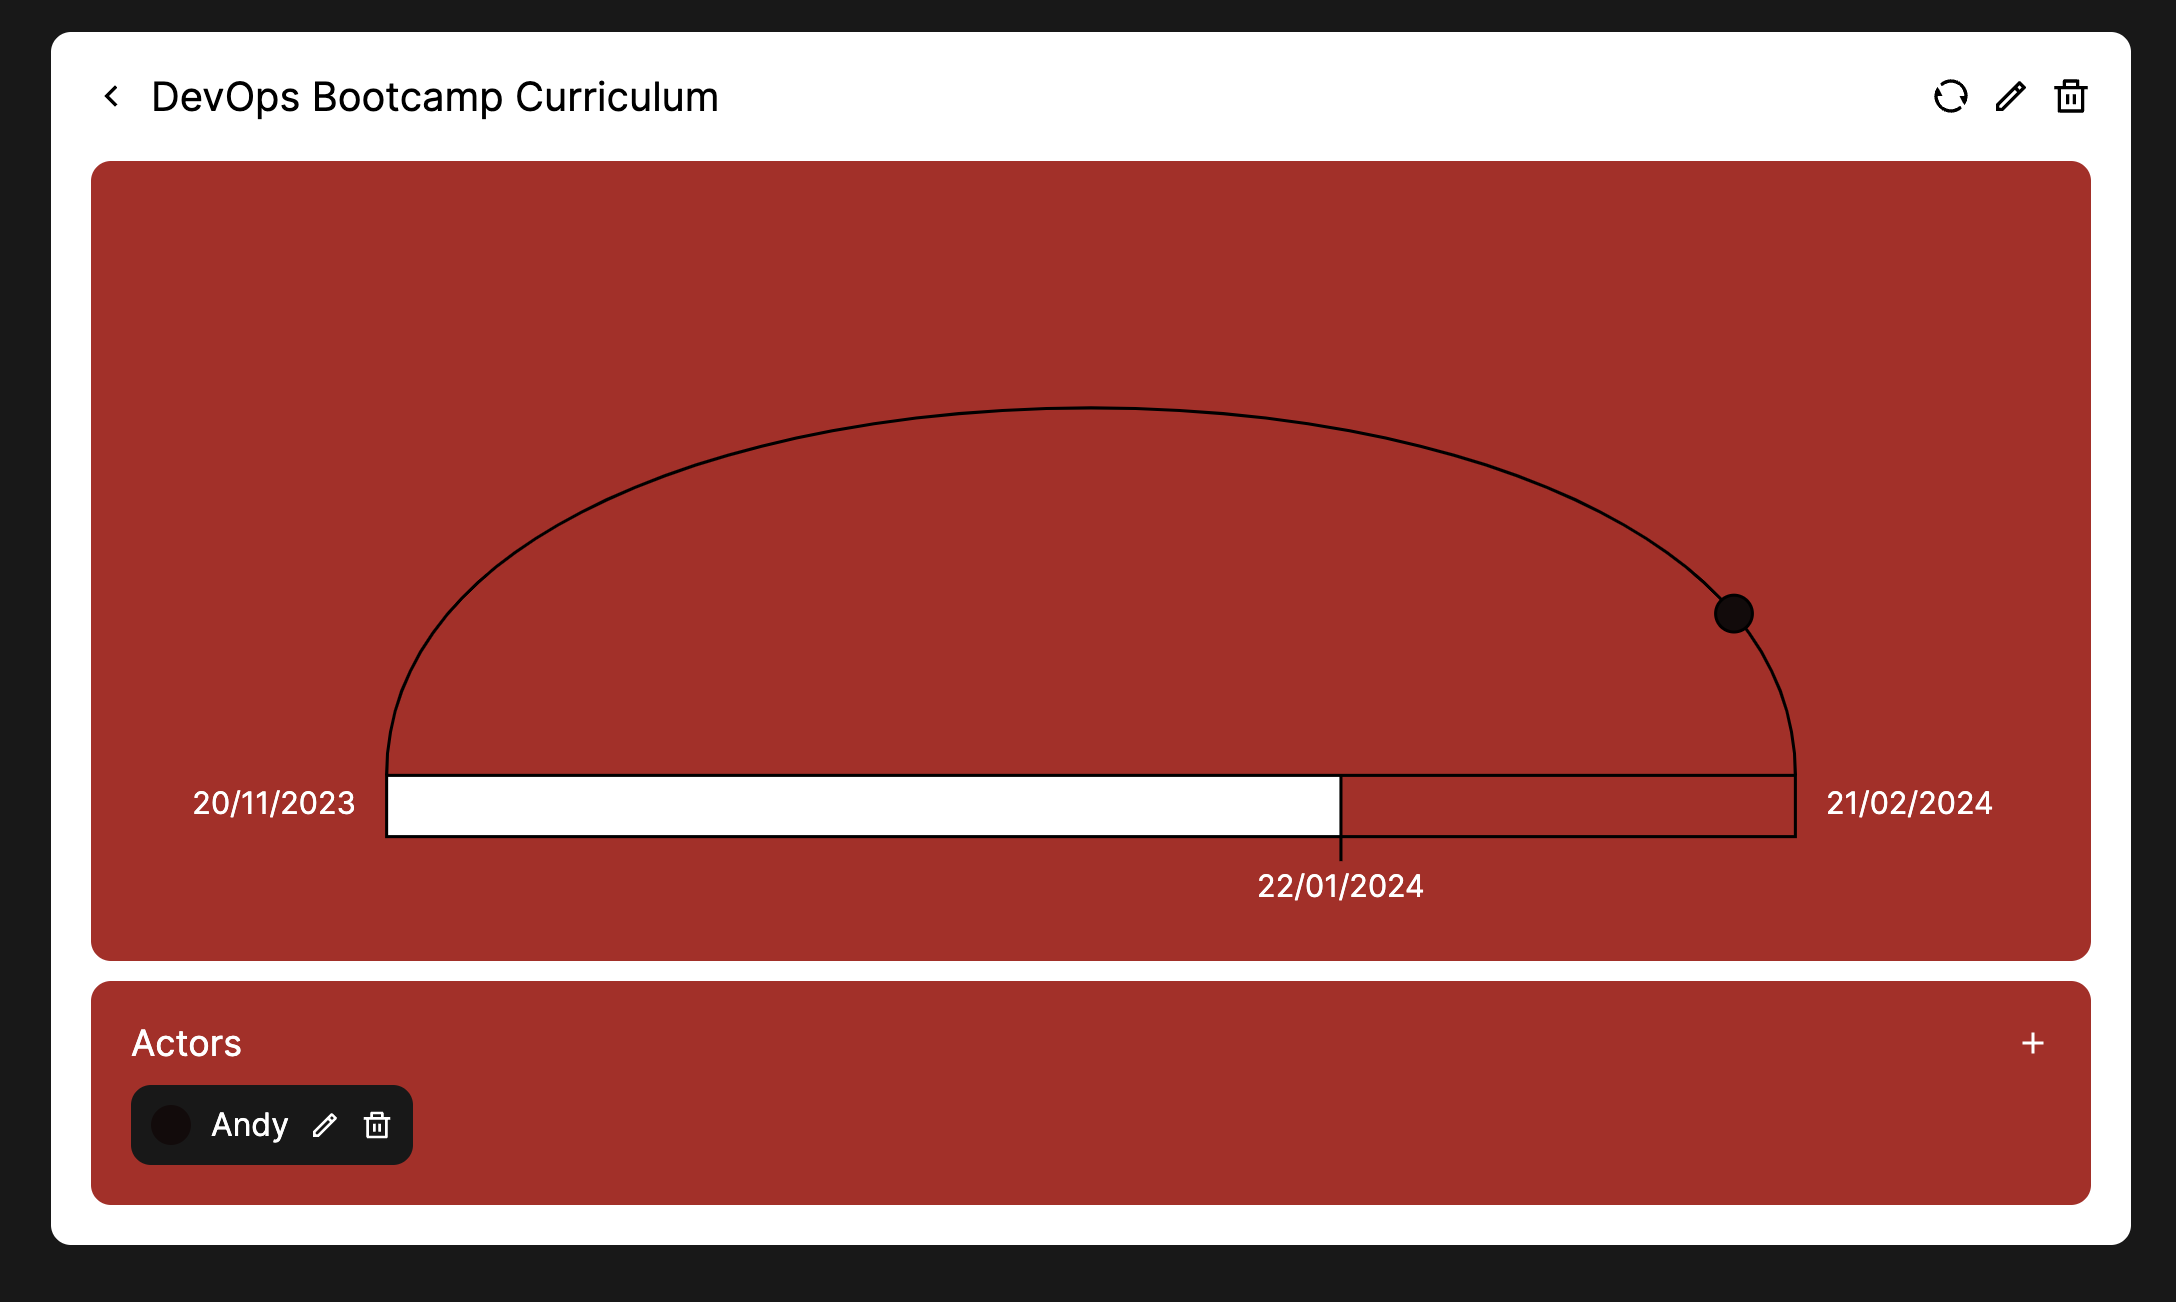
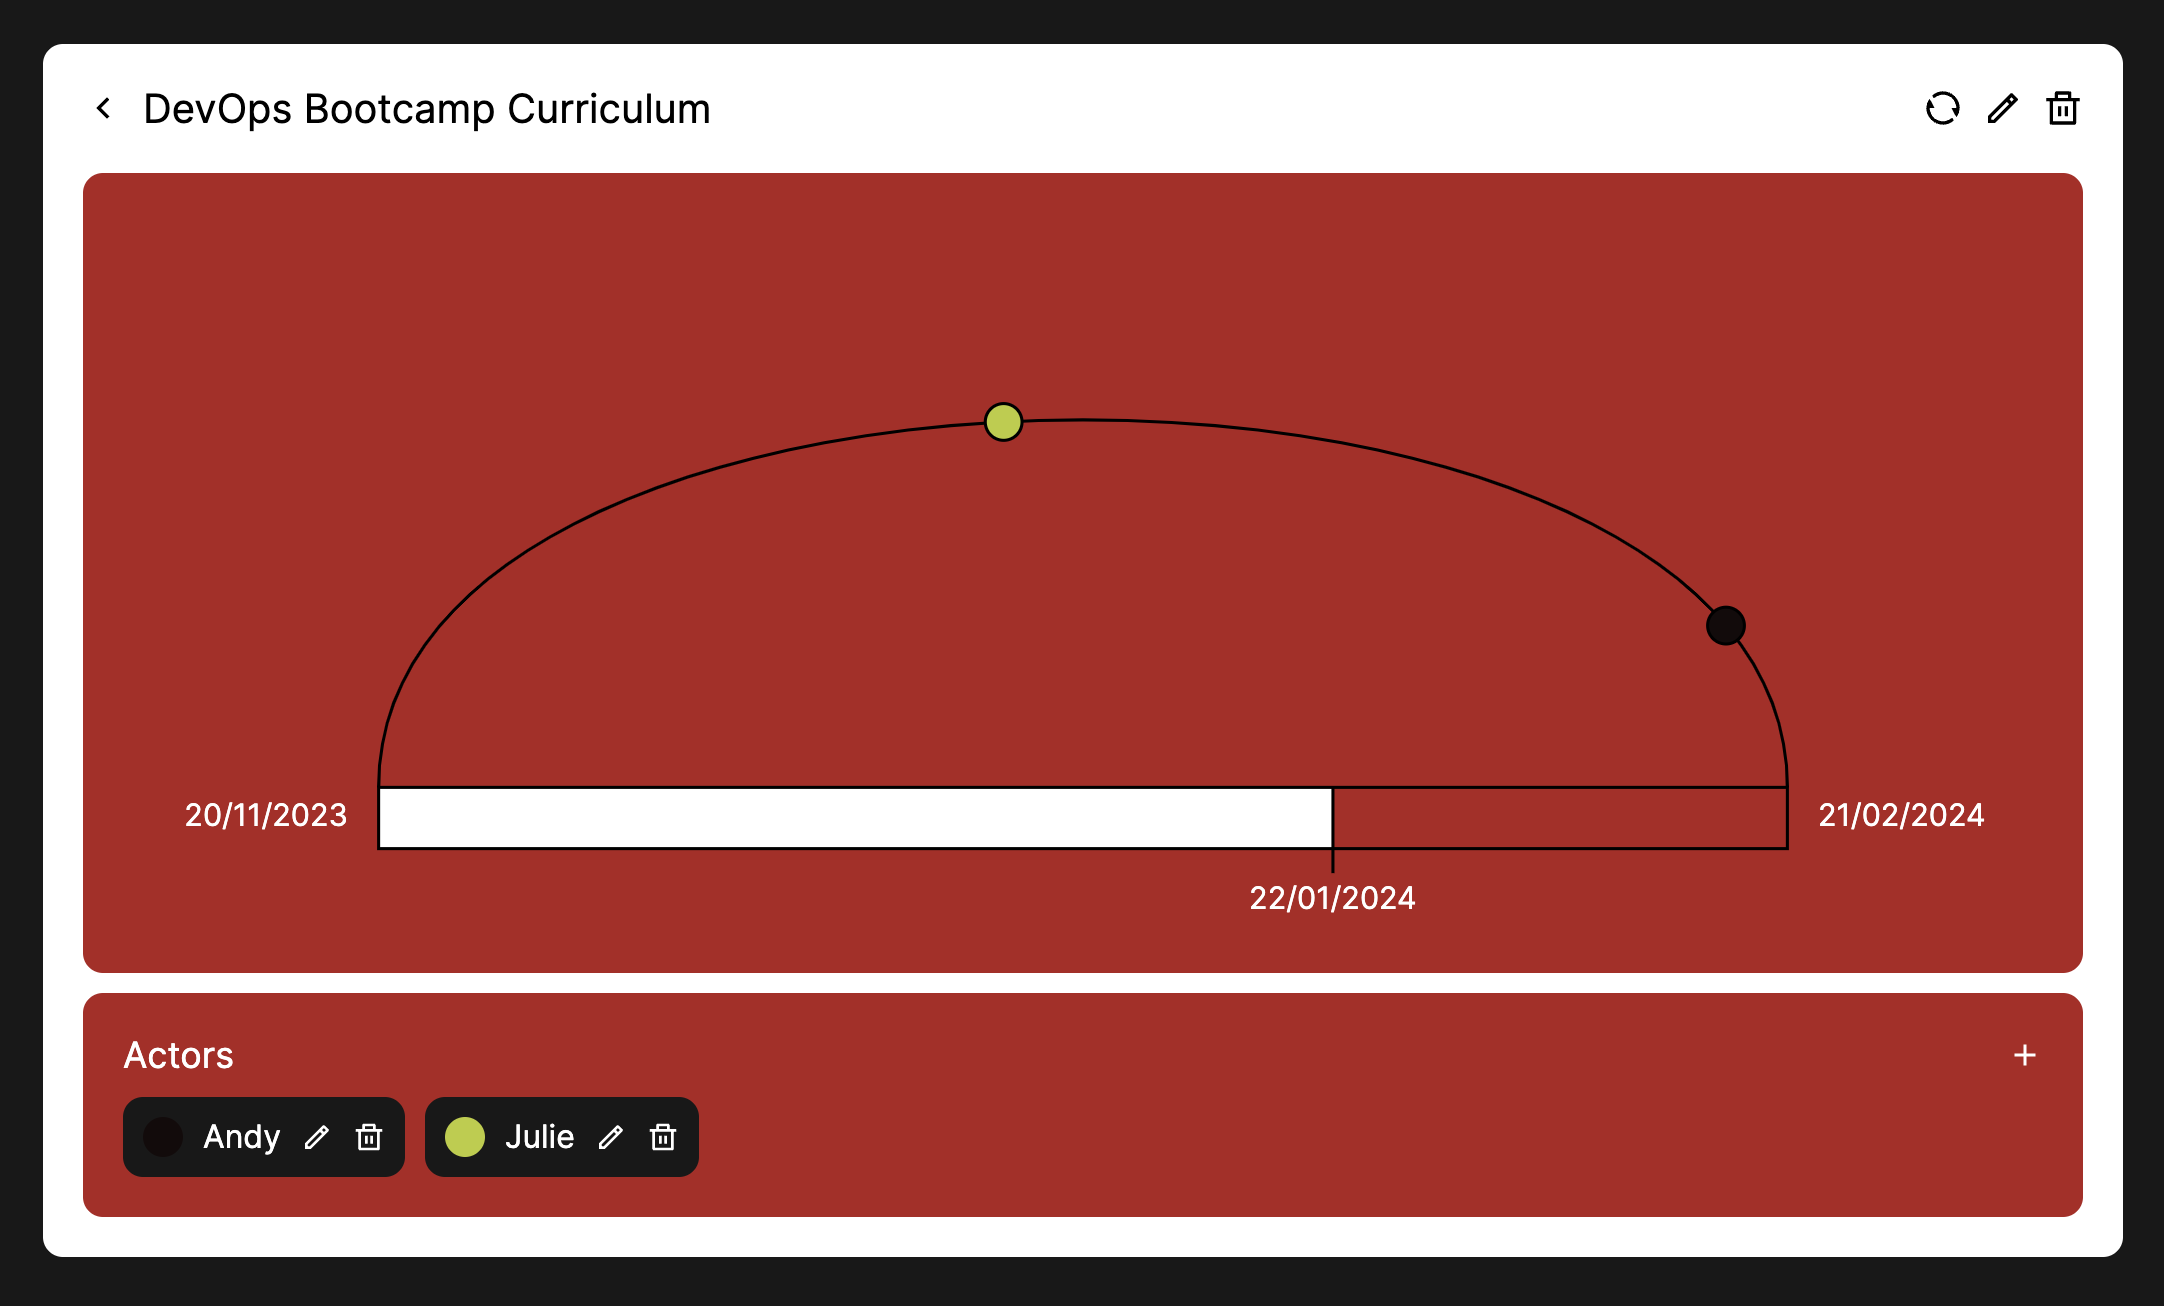
Actors are all individuals involved in the project. In our case, Actors are usually project managers, business analysts, and engineers, so we typically have at least three actors in the Cockpit diagram. Each Actor can move a small circle representing them in the project according to the project's conditions. Each Actor will have their position, as their view of the project's progress may differ. For example, an engineer may consider progress to be fast because many tickets are completed, so they move their Actor's point far to the right on the Progress Line. However, a Project Manager may still hold back progress because they know there are some blockers that will hinder the project.
Progress Line
The Progress Line is a curved line upwards resembling a hill. This upward curve illustrates the actual project conditions, where progress usually starts slow at the beginning of the project, similar to a climber slowly ascending a hill. The further to the right, it can be assumed that the project is approaching completion.
How to read The Cockpit Diagram
The simple diagram below can convey a lot of information. For example, if the timeline is nearing the end date while the Actor points on the Progress Line are still far from the finish point, this signals that the project is in trouble and needs immediate attention. Conversely, if the timeline is far from the end date while the Actor points on the Progress Line are close to the finish point, the project is running smoothly. Ideally, actor points will be roughly parallel to the timeline points.
In other cases, such as a significant gap between two Actor points, something abnormal may be happening in the project.
Try it for free on https://cockpit.8grams.tech, and feel free to share your experience with it on [email protected] or mention me on X (@8grams_tech).
Frequently Asked Questions
What is Cockpit by 8grams?
Cockpit is a free project monitoring dashboard from 8grams that gives project managers and stakeholders a bird's-eye view of multiple projects at once. Inspired by the Hill Chart from Basecamp, it visualizes each project with a Timeline, a Progress Line, and Actors. You can use it at cockpit.8grams.tech with a Gmail account.
How do you read a Cockpit Hill Chart diagram?
A Cockpit diagram combines a Timeline, a curved Progress Line, and Actor points. If the Timeline nears the end date while Actor points remain far from the finish, the project is in trouble and needs attention. If Actor points are advanced while the Timeline still has room, progress is healthy.
What are Actors in Cockpit?
Actors in Cockpit are the individuals involved in a project, typically project managers, business analysts, and engineers. Each Actor moves a small circle along the Progress Line to reflect their own view of progress. Because perspectives differ, an engineer and a project manager may place their points at different positions on the same project.
Why use a Hill Chart instead of a task completion dashboard?
A task completion summary can misrepresent real project status, showing all tasks done even when blockers stall progress. Cockpit's Hill Chart instead captures the actual condition of a project through Actor positions on a Progress Line, revealing whether work is truly advancing. This gives a more honest, objective overview than counting completed tasks.
Is Cockpit free to use?
Yes, Cockpit is free with no usage limitations. According to 8grams, the tool does not collect your data or track your activity while you use it. You only need a Gmail account to register or log in, then create an organization to start monitoring projects at cockpit.8grams.tech.
The culture around football apparel reaches from stadium terraces to everyday collections because it links personal memory with the wider culture of the game. Discussions about player issue details give collectors a reason to look beyond the most recent release. Those exploring club collections may also consider, Argentina national team shirt is a clear search phrase for readers comparing styles and versions. The focus on fit and fabric shows how football apparel can carry history without becoming a sales pitch.